DASHBOARD: COVID-19 CASES AT MATC
February 23, 2023: The public facing COVID-19 dashboard will no longer be updated or published. Students and staff can refer to the county's online COVID dashboard.
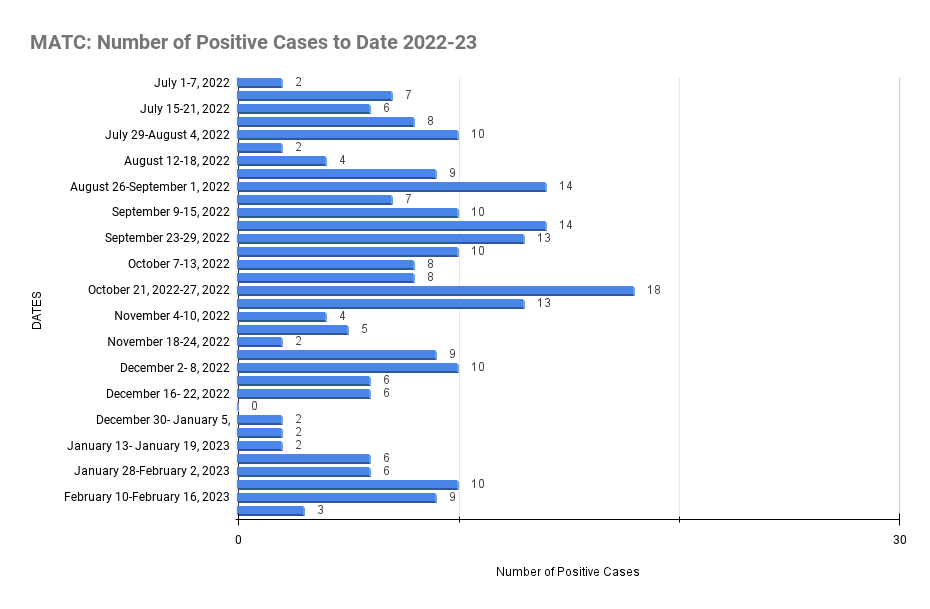
This chart shows the number of times MATC has activated its COVID-19 contact investigation protocol. These numbers are based on self reporting of students, employees and contractors.
Effective 8/1/22: The contact investigation protocol is activated when a person who has been on campus reports a positive COVID-19 test result and has been on campus 7 days prior to the positive test result.
Information reflects cases reported from July 1, 2022 to the present. This dashboard shows cases by week and is updated daily.
| Campus | Students | Employees | Vendors/ Contractors |
|---|---|---|---|
| Downtown Milwaukee | 88 | 81 | 0 |
| Mequon | 11 | 7 | 0 |
| Oak Creek | 27 | 14 | 0 |
| West Allis | 5 | 15 | 0 |
| Education Center at Walker's Square | 0 | 2 | 0 |
| Subtotal | 131 | 119 | 0 |
| TOTAL | 250 |
MATC Coronavirus Data - TOTAL CASES
Information reflects cases reported from July 1, 2022 to the present.
This chart shows cases by week and is updated weekly.
MATC Number of Positive Cases to Date June 1, 2021 - June 30, 2022 (pdf)
COVID-19 Key Indicators:
https://docs.google.com/document/d/1fjEKL3s4LMPlaCpAzUC3P1Ba0yq84zk/edit
Milwaukee County (as of 1/12/23)
Cases: Yellow
Test Positivity: Red
Care: Green
Vaccination: Yellow
CDC COVID COMMUNITY LEVEL: Milwaukee County (Medium)
On Campus Mask Recommendation: Mask Friendly
MATC Data: 1/4/2023
Cases: Green
Tracing: Green
PPE/Supplies: Green
Stakeholders: Green